
Overview
Enterprise Monitoring Solutions
Monitoring your business’s critical infrastructure can feel like a superhuman task – but fortunately, we’re here to help. We partner with several leading technology vendors to ensure you have real-time intelligence, insight, and analytics on how your business systems are performing – right down to the last router, switch, and firewall.
We offer Enterprise Monitoring solutions in three levels of service. Set up a demo with us and see which service-tier works best for you.
Watch our Monitoring for Utilities webinar
Schedule a Demo
Get Started Today
Find out how FirstLight can help protect your organization. Contact our team today and we’ll provide you with the details and get you started with a demo.
Feature Sets
Level 1: See It
- Web portal to view network inventory
- Dashboard to view all nodes and interfaces
- Node/port/circuit status
- Bandwidth usage statistics per node interface
Level 2: See It + Know It
- Alert on device status
- Alert on bandwidth usage
- Alert on interface errors and drops
- Alert on interface status
Level 3: See It + Know It + Report It
- Generate historical reports on-demand
- Setup scheduled reports
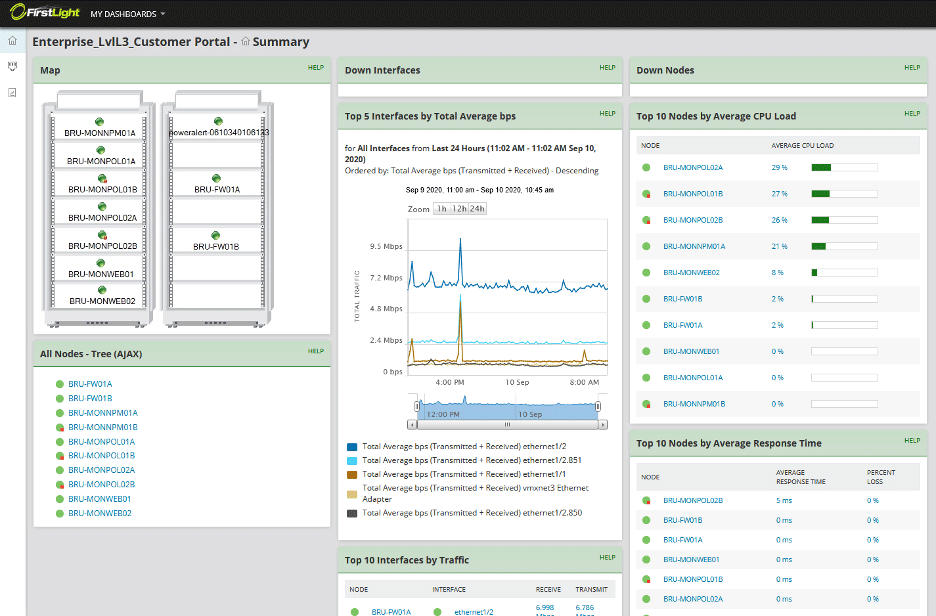
- Enable at-a-glance visual of your network topology, and its current status with a high-level topology map detailing current status
| Features | Level 1 | Level 2 | Level 3 |
|---|---|---|---|
| Web Portal | X | X | X |
| Device Inventory (type, hostname, IP, and more) | X | X | X |
| Equipment Health Status such as CPU, memory, and availability | X | X | X |
| Critical interface monitoring including utilization and availability | X | X | X |
| Current event summary | X | X | X |
| Alert on device and/or critical interface status | X | X | |
| Alert on interface thresholds including packet errors and drops | X | X | |
| Alert on bandwidth thresholds | X | X | |
| Ad-hoc historical reporting | X | ||
| Scheduled historical reporting | X | ||
| High level network topology map | X |
Related News and Resources


FirstLight Launches the Next Phase of its Unified Communications Evolution
Press Releases
Changes Include Advanced UC Features and an Enhanced Customer Experience Albany, NY – April 9, 2025 – FirstLight, a leading provider of digital infrastructure services…

Brunswick, Maine Data Center Expansion Results in Additional Power and Increased Capacity
Press Releases
Renovations Have Doubled Power Capacity Albany, NY – February 4, 2025 – FirstLight, a leading provider of digital infrastructure services to enterprise and carrier customers…

What You’ve Always Wanted to Know About Data Security but Were Afraid to Ask
Light Thoughts
As an IT professional, you’re likely concerned about cybersecurity and the implications of a ransomware attack…and for good reason. But isn’t there a fine line…

FirstLight and Maine Connectivity Authority Sign Agreement to Build 450 Miles of Fiber in Western Maine
Press Releases
Project Will Provide High-Speed Internet to More Than 6,600 New Locations Albany, NY – November 20, 2024 – FirstLight, a leading provider of digital infrastructure…

A cyber-attack is a big problem for a small business.
Blog
When a big business falls victim to a ransomware attack, we see it in the news. This gives a false impression that smaller organizations are…


FirstLight Launches the Next Phase of its Unified Communications Evolution
Press Releases
Changes Include Advanced UC Features and an Enhanced Customer Experience Albany, NY – April 9, 2025 – FirstLight, a leading provider of digital infrastructure services…
Brunswick, Maine Data Center Expansion Results in Additional Power and Increased Capacity
Press Releases
Renovations Have Doubled Power Capacity Albany, NY – February 4, 2025 – FirstLight, a leading provider of digital infrastructure services to enterprise and carrier customers…
What You’ve Always Wanted to Know About Data Security but Were Afraid to Ask
Light Thoughts
As an IT professional, you’re likely concerned about cybersecurity and the implications of a ransomware attack…and for good reason. But isn’t there a fine line…
